Make Your Sites Fast, Accessible And Secure With Help From Google
Dion AlmaerEarlier this year, the Chrome team announced the Web Vitals initiative to provide unified guidance, metrics, and tools to help developers deliver great user experiences on the web. The Google Search team also recently announced that they will be evaluating page experience as a ranking criteria, and will include Core Web Vitals metrics as its foundation.
The three pillars of 2020 Core Web Vitals are loading, interactivity, and visual stability of page content, which are captured by the following metrics:

- Largest Contentful Paint measures perceived load speed and marks the point in the page load timeline when the page’s main content has likely loaded.
- First Input Delay measures responsiveness and quantifies the experience users feel when trying to first interact with the page.
- Cumulative Layout Shift measures visual stability and quantifies the amount of unexpected movement of page content.
At web.dev LIVE, we shared best practices on how to optimize for Core Web Vitals and how to use Chrome DevTools to explore your site or app’s vitals values. We also shared plenty of other performance-related talks that you can find at web.dev/live in the Day 1 schedule.
tooling.report
The web is a complex platform and developing for it can be challenging at the best of times. Build tools aim to make a web developer’s life easier, but as a result build tools end up being quite complex themselves.
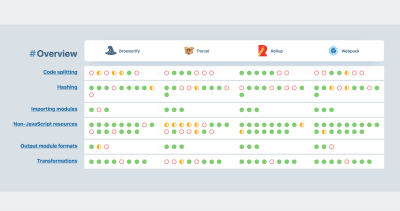
To help web developers and tooling authors conquer the complexity of the web, we built tooling.report. It’s a website that helps you choose the right build tool for your next project, decide if migrating from one tool to another is worth it, or figure out how to incorporate best practices into your tooling configuration and codebase. We aim to explain the tradeoffs involved when choosing a build tool and document how to follow best practices with any given build tool.
We designed a suite of tests for the report based on what we believe represents the best practices for web development. The tests allow us to determine which build tool allows you to follow what best practice and we worked with the build tool authors to make sure we used their tools correctly and represented them fairly.

The initial release of tooling.report covers webpack v4, Rollup v2, and Parcel v2 as well as Browserify+Gulp, which we believe are the most popular build tools right now. We built tooling.report with the flexibility of adding more build tools and additional tests with help from the community.
So if you think a best practice that should be tested or is missing, please propose it in a GitHub issue and if you’re up for writing adding a new tool we did not include in the initial set, we welcome you to contribute!
Meanwhile, you can read more about our approach towards building tooling.report and watch our session from web.dev LIVE for more.
Latest In Chrome DevTools And Lighthouse 6.0
Most web developers spend a lot of time of their day in their developer tools so we want to ensure that our tools enable greater productivity, whether it’s for debugging or for auditing and fixing issues to improve user experience.
Chrome Devtools: New Issues Tab, Color Deficiency Emulator And Web Vitals support
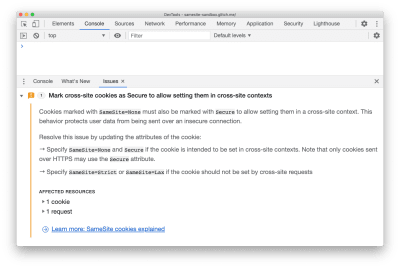
One of the most powerful features of Chrome DevTools is its ability to spot issues on a webpage and bring them to the developer’s attention — this is most pertinent as we move into the next phase of a privacy-first web. To reduce notification fatigue and clutter of the Console, we’ve launched the “Issues Tab” that focuses on three types of critical issues to start with: Cookie problems, Mixed content and COEP issues. Watch our session on finding and fixing problems with the Issues Tab for more.

Moreover, with Core Web Vitals becoming one of the most critical sets of metrics that we believe every developer must track and measure, we want to ensure developers are able to easily track how they perform against these thresholds. So we’ve added the three metrics in the Chrome DevTools timeline.
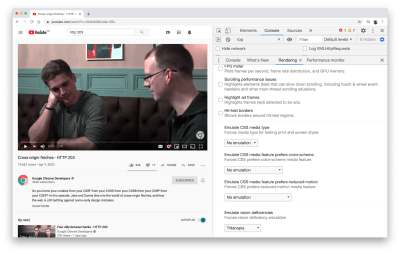
And finally, with an increasing number of developers focusing on accessibility, we also introduced a Color Vision Deficiency Emulator that allows developers to simulate vision deficiencies, including blurred vision & various other types of color blindness. We’re super excited to bring this feature to developers who’re looking to make their websites more color-blind friendly and you can see more about this and many other features in our session on What’s the latest in DevTools.

Lighthouse 6.0: New Metrics, Core Web Vitals Lab Measurement, An Updated Performance Score, And Exciting New Audits
Lighthouse is an open-source automated tool that helps developers improve their site’s performance. In its latest version, we focused on providing insights based on metrics that give you a balanced view of your user experience quality against critical dimensions.
To ensure consistency, we’ve added support for the Core Web Vitals — LCP, TBT (lab equivalent for FID as Lighthouse is a lab tool) and CLS — and removed three old ones: First Meaningful Paint, First CPU Idle, and Max Potential FID. These removals are due to considerations like metric variability and newer metrics offering better reflections of the part of user experience that we’re trying to measure. Additionally, we also made some adjustments to the weights based on user feedback.
We also added a super nifty scoring calculator to help you explore your performance scoring, by providing a comparison between version v5 and v6 scores. When you run an audit with Lighthouse 6.0, the report comes with a link to the calculator with your results populated.
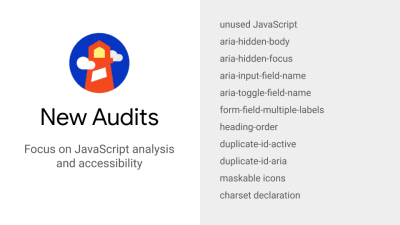
And finally, we added a bunch of useful new audits, with a focus on JavaScript Analysis and accessibility.

There are many others that we spoke about at web.dev LIVE — watch the session on What’s latest in speed tooling and the latest in Puppeteer.
During web.dev LIVE, we shared more new features and updates that have come to the web over the past few months. Watch all the sessions to stay up to date and subscribe to the web.dev newsletter if you’d like more such content straight to your inbox.

from Tumblr https://ift.tt/2VR0b4i
No comments:
Post a Comment